IXL District Analytics provides clear, useful insights that let district administrators identify where support is needed and lead improvement efforts across schools. Now, administrators will be able to see even more details about each of their students directly within IXL Analytics with new demographic data!
Demographic data in District Analytics, also available in School Analytics, makes it easier for administrators to compare usage and diagnostic data among specific student groups they’re interested in. It’s another tool to help facilitate strategic instructional decisions across schools!
Ready to see how demographic data makes District Analytics reports more powerful? Let’s take a look.
Demographic data in IXL
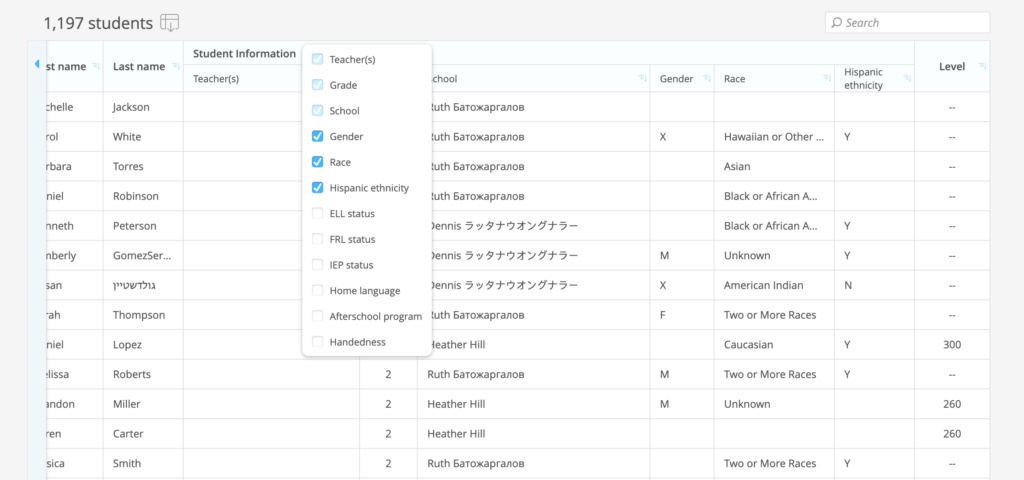
IXL can now collect student demographic data through all rostering methods available to districts. The standard demographic data IXL collects includes:
- Gender
- ELL status
- FRL status
- IEP status
- Home language
- Race
- Hispanic ethnicity
Additionally, IXL supports custom demographic data based on individual district needs.
Using demographic data in District Analytics
Administrators can use any demographic data rostered to their district’s IXL account to filter and sort District Analytics reports. Use the drop-down menus near the top of the reports to select filters. Demographic data will also appear in exports and visualizations for reports.
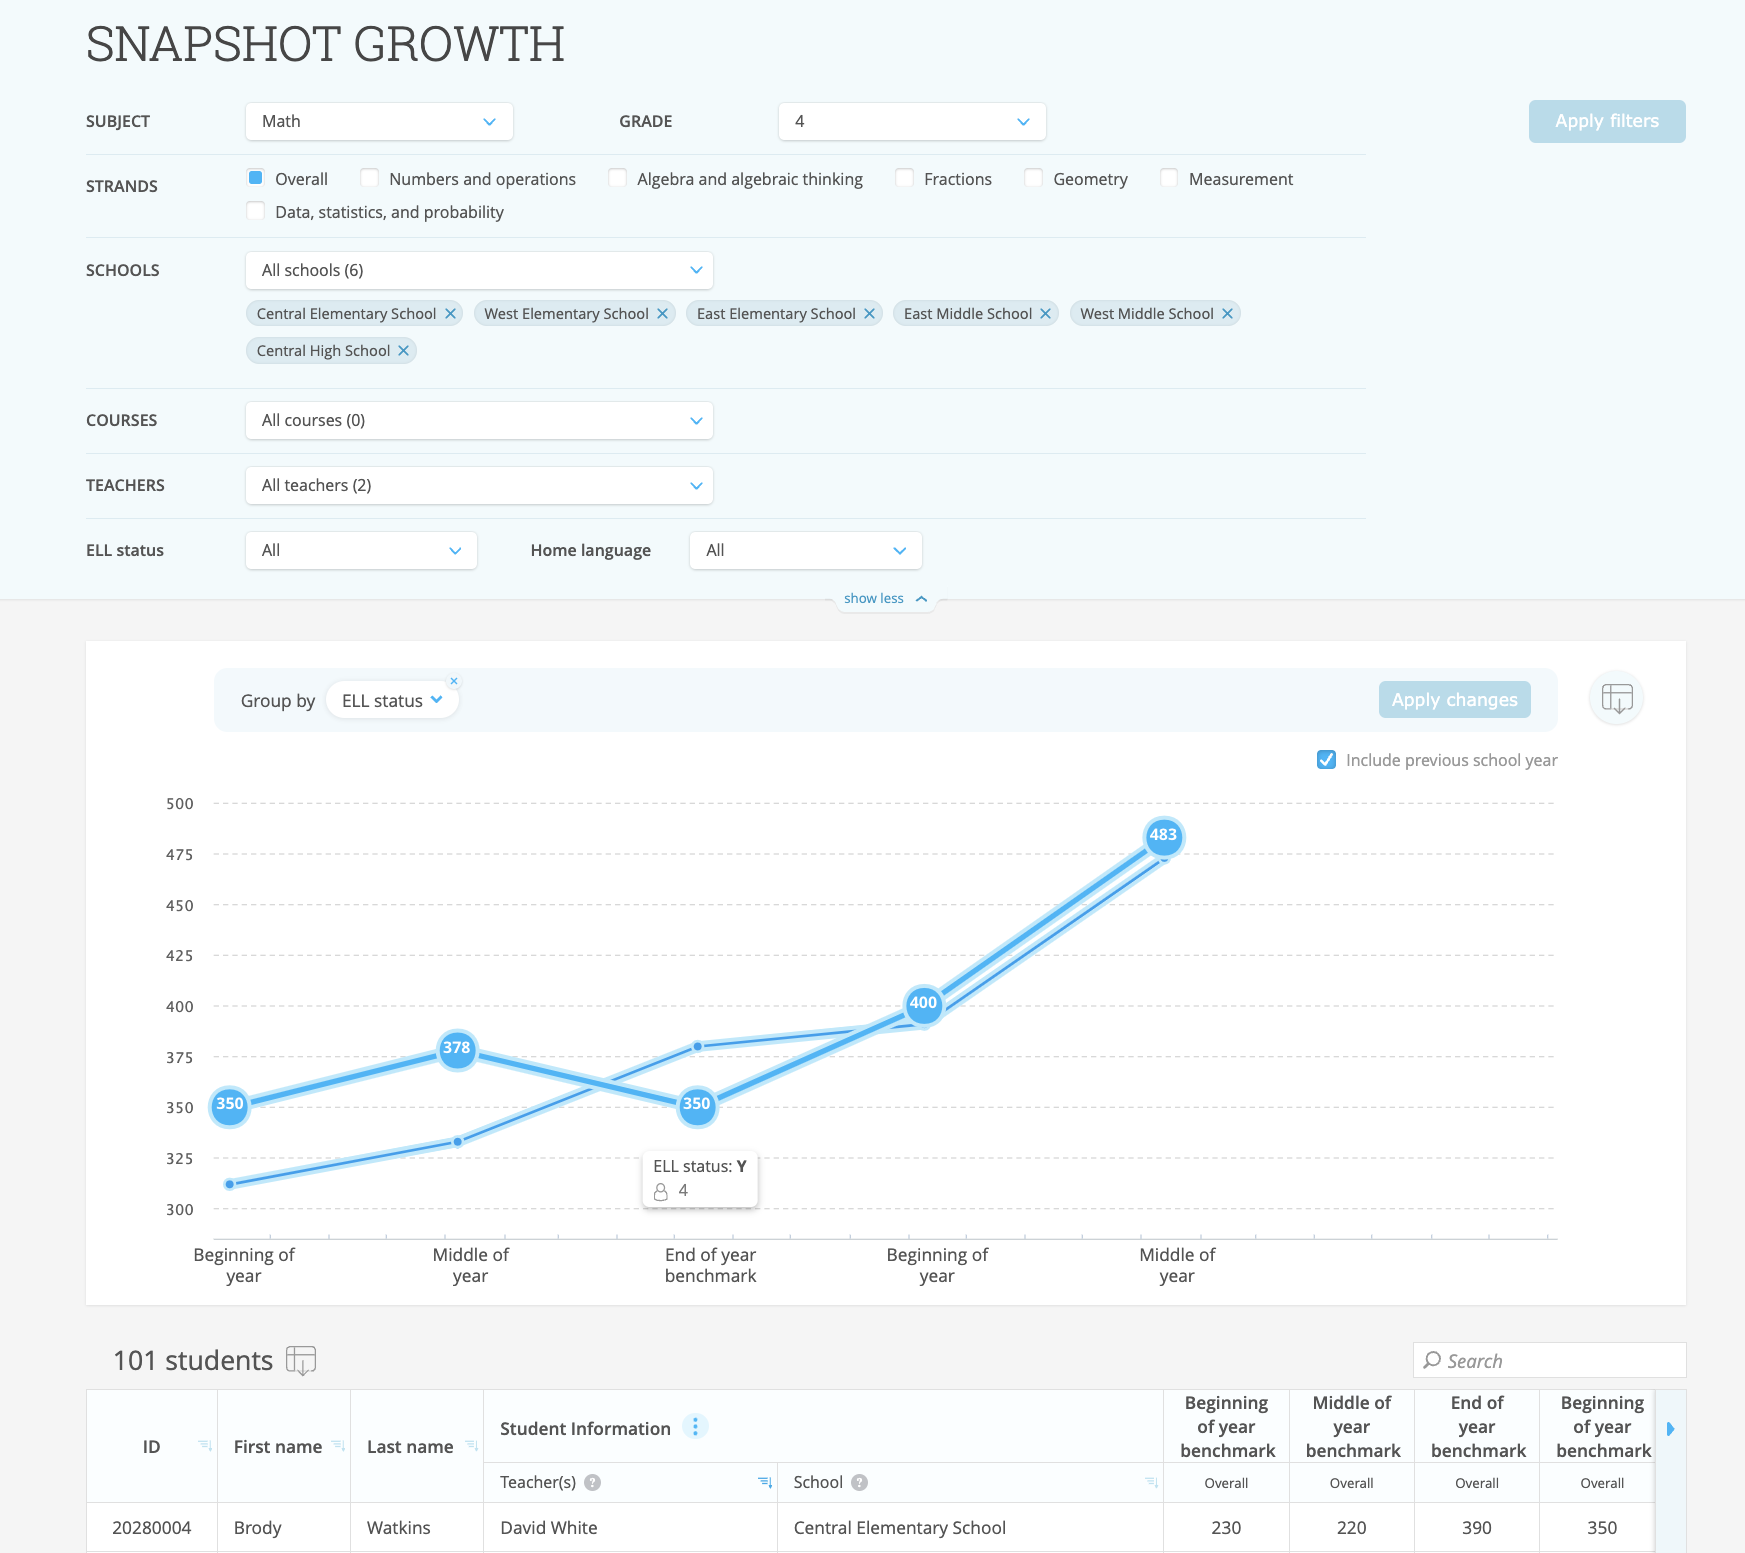
With so much student data available, IXL district reports now also feature a new “group by” option to help administrators dig into it. Administrators can group students by multiple categories, including grade, school, course, teacher, and any rostered demographic, letting them easily see specific student subgroups. Want to see a breakdown of students by both grade and FRL status? It’s only a few clicks away in IXL!

Using IXL’s demographic data, administrators can streamline their in-depth analysis, surface actionable insights, and save themselves valuable time. Discover more powerful strategies to support your schools in our admin resource center.