
What if you could go one level (or more) deeper to get more insights from your data? Take full advantage of IXL’s robust reporting by including your demographic and course data in Analytics!
With demographic and course data you’ll gain a new level of visibility into your students, allowing you to answer key questions for your school or district. In this blog, we’ll show you the ways demographic and course data can enhance your IXL reports, and how you can add it.
Discover deeper insights
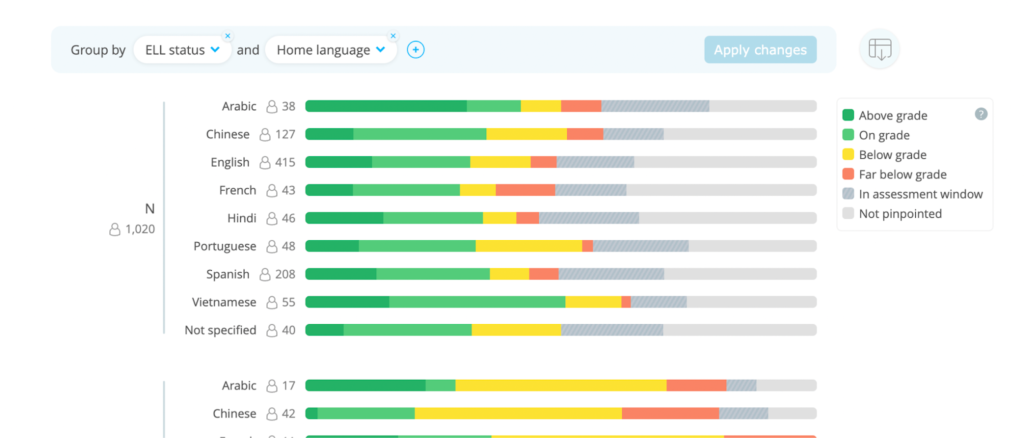
Adding demographic and course data to IXL gives you a more complete picture of your student population. Demographics in Analytics empower you to compare usage and performance among specific student groups you’re interested in. Some examples include:
- Race
- Gender
- ELL status
- FRL status
- IEP status
- Home language
- Hispanic ethnicity
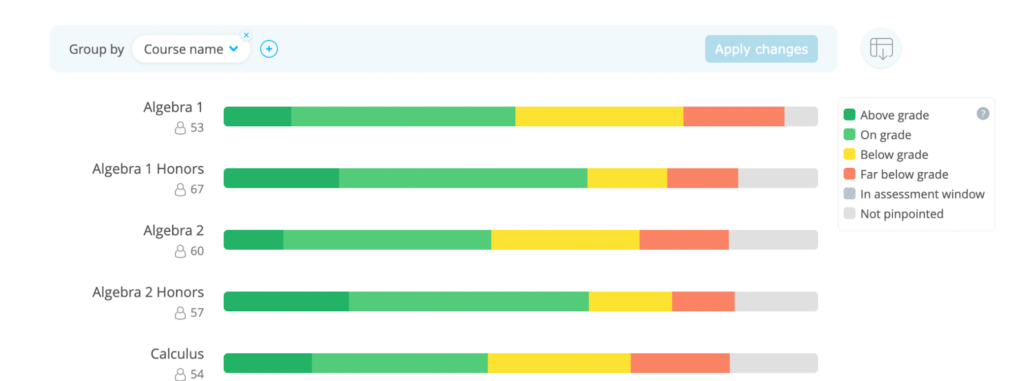
At the same time, courses help you easily identify groups of students who are learning the same material. You can see where students are and where they’re expected to be relative to their subject level, rather than just their grade level.
This information is extremely useful for evaluating differentiation, especially in programs such as high school math, in which it’s common for students from different grade levels to take the same courses.
Transform data into detailed findings
Adding demographic and course data will take your IXL reports to the next level. You’ll be able to see diagnostic results, skill proficiency, and other reports grouped by categories like course, race, gender, or IEP status within a school or grade. You can even compare multiple groups in the same report to pull out the crucial information you need.
For example, do you want to compare students based on home language while separating them by ELL status? In a few clicks you can sort reports by up to three demographics groups and by courses to enable precision analysis.
How to add demographic and course data
Depending on whether you manually roster on IXL or you use an auto-rostering system, you’ll follow a different process for adding your demographic and course data. If you need assistance, reach out to your account services specialist and they’ll be happy to help.
Manual roster
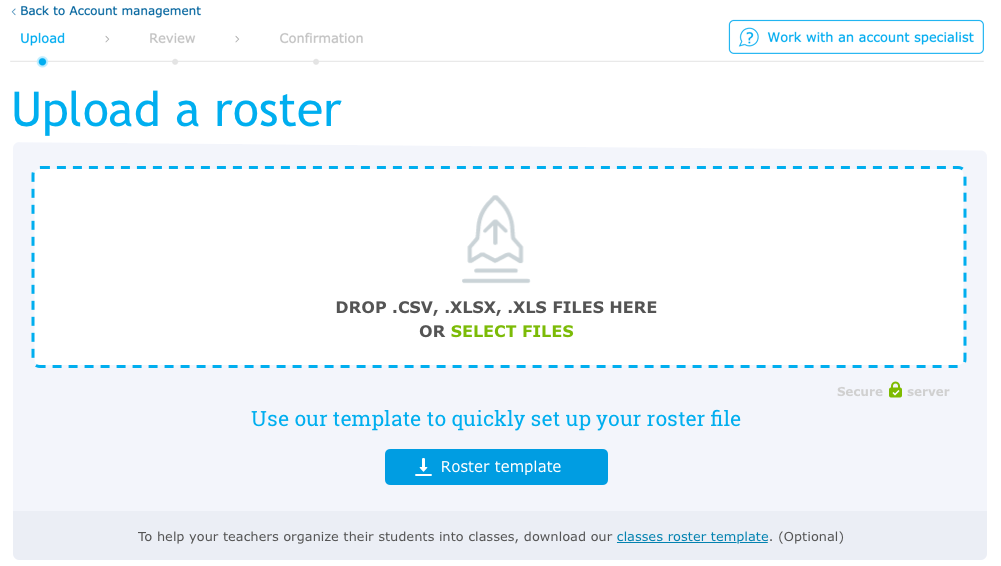
If you upload a spreadsheet of your students to IXL, that means you roster manually. You can add fields and data to your spreadsheet for the demographics and courses you would like to include, then upload it to IXL. For best results, we recommend downloading IXL’s pre-formatted roster template from the roster upload page. It includes fields for demographics and courses.
Auto-roster
If you handle rostering through Classlink or Clever, that means you use an auto-roster. IXL’s integration will automatically capture the data in your auto-roster and your student information system (SIS). All you have to do is add demographic and course data to your SIS and the roster data shared with your auto-roster.
If you use Clever
Clever considers the following demographic data to be sensitive information:
- ELL status
- FRP status
- IEP status
By default, sensitive information is not included in Clever data sharing. To get this demographic data in IXL, you’ll need to check your Clever settings and enable sharing of these sensitive data fields.
Use IXL Analytics to its full potential by making demographic and course data a part of your rostering process!