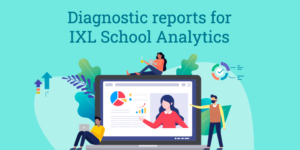
Note: In March 2025, we updated the names of IXL’s diagnostics to better reflect the capabilities of our assessments! The assessment names, report titles, and other related terminology in this blog post may not be current. Get more information on the IXL Diagnostics here.
IXL School Analytics empowers school administrators to answer key questions about students and maximize IXL’s impact. Now, school leaders have access to the same comprehensive diagnostic reports as district administrators, granting even more insight and control over school-wide data.
Each of these four reports gives school leaders new ways to visualize data, boost progress, and facilitate meaningful conversations. Plus, advanced filtering, grouping, and export options help you extract and share the precise details you’re looking for. Read on to learn more about these diagnostic reports and how they can help you.
Diagnostic reports overview
There are four diagnostic reports new to IXL School Analytics:
- Diagnostic Levels
- Diagnostic Tier Analysis
- Diagnostic Strands
- Snapshot Growth
All of these reports are designed to be flexible, whether you want to view performance across your entire school or drill down to individual classrooms and students. Use them to quickly access the data you need thanks to powerful filtering options that let you compare data by subject, grade, strand, time frame, course, teacher, and demographics. You can even group students by multiple categories, such as grade, course, teacher, and demographics, to surface key insights. Then, share your findings by exporting any report as a shareable .CSV file.
Let’s take a look at each report in more detail:
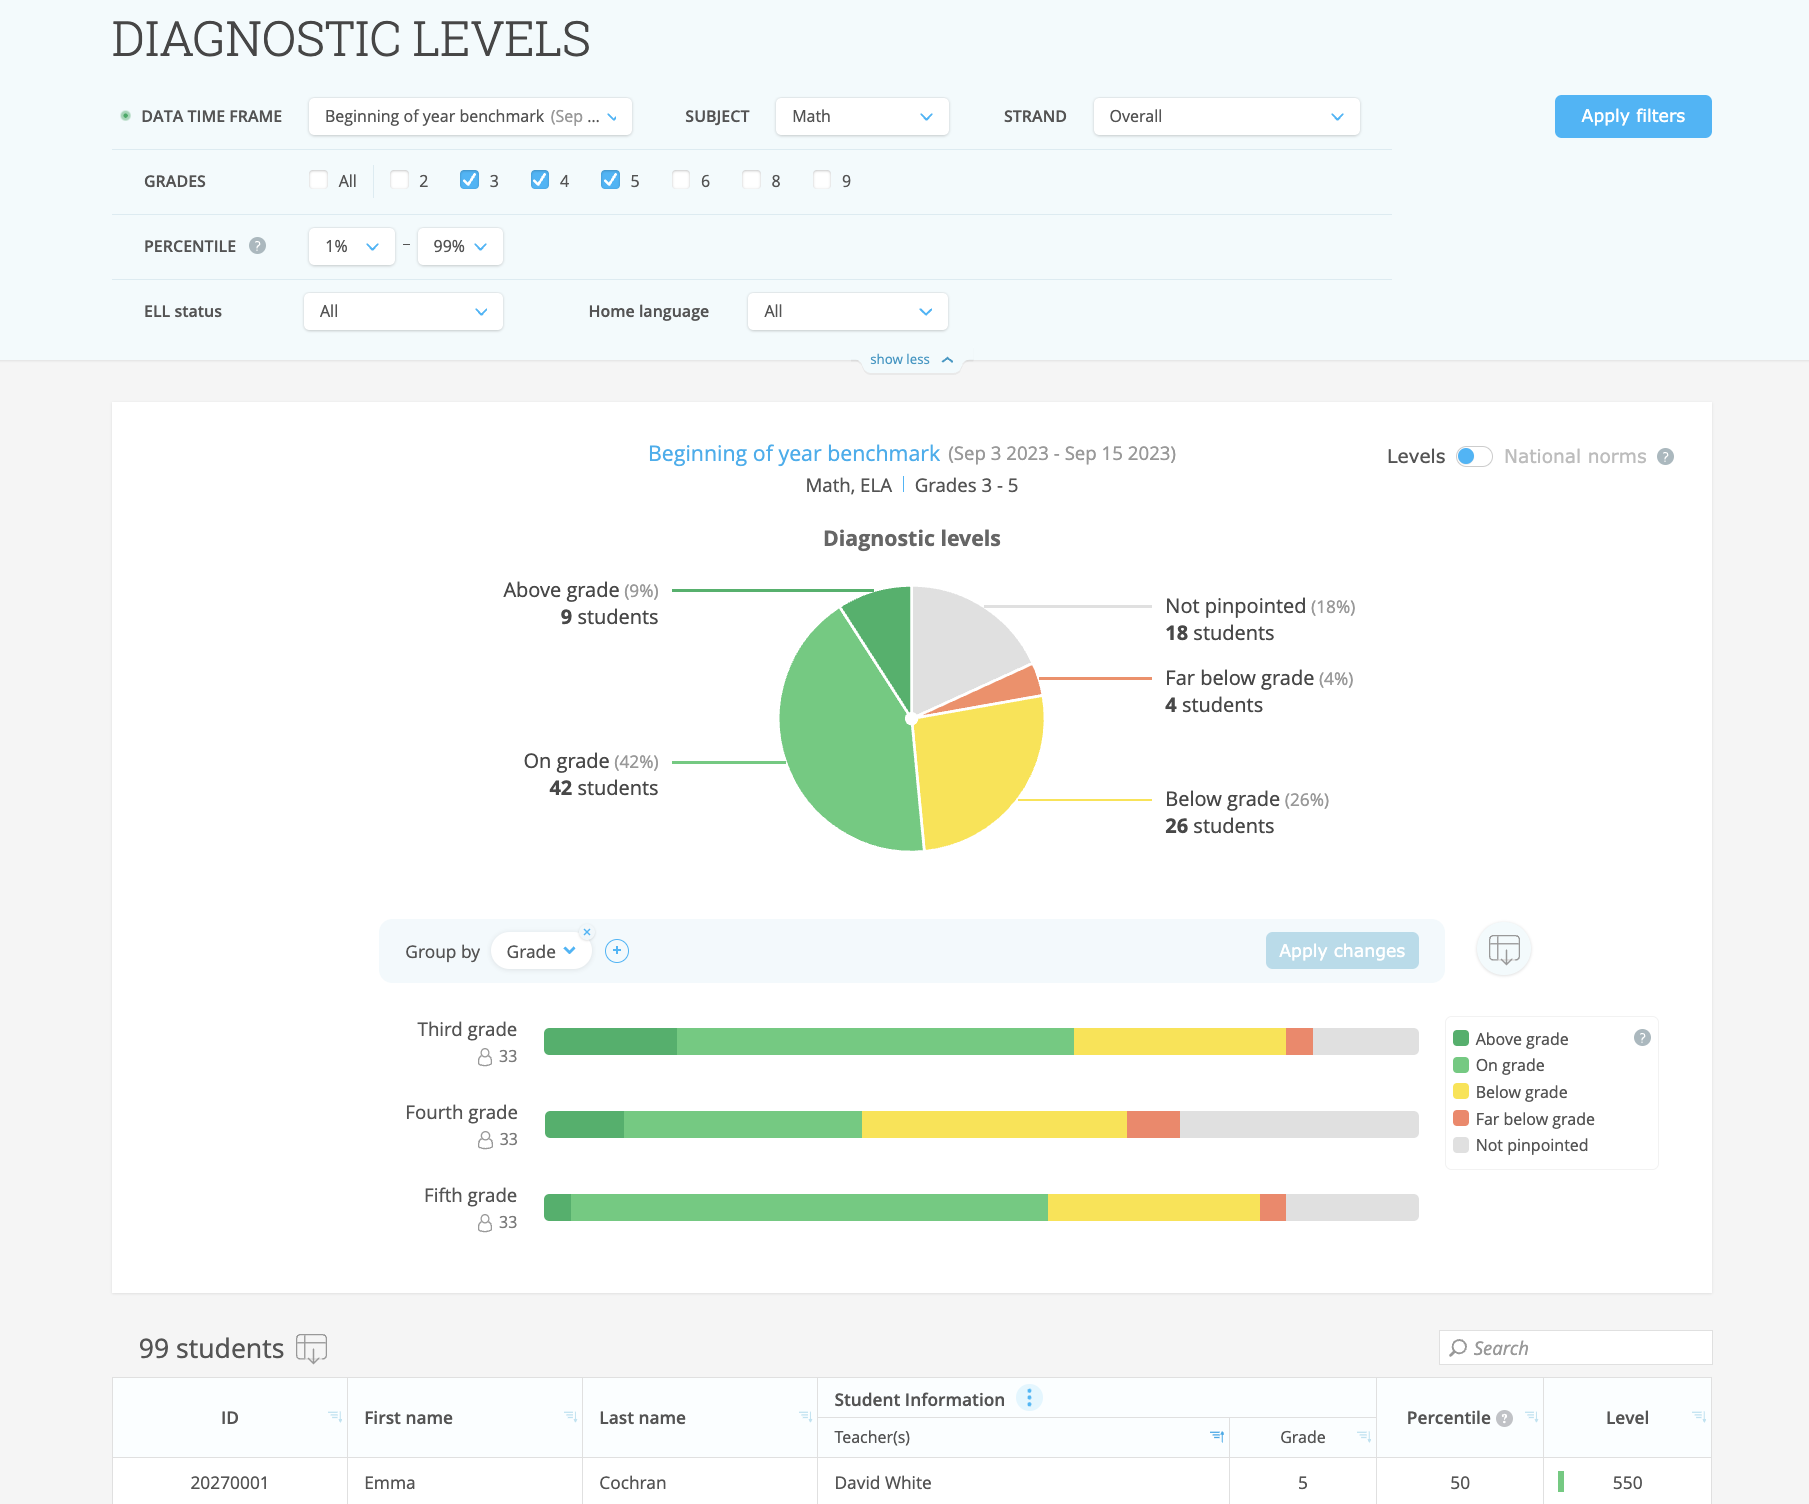
Diagnostic Levels report
The Diagnostic Levels report shows you student knowledge levels at a glance. It helps you quickly identify which students are above, on, or below grade level, as well as those who are in an assessment window or have yet to pinpoint their levels.
Use it to facilitate conversations on intervention and classroom placement, or to remind teachers to keep their students’ knowledge levels up to date in the Real-Time Diagnostic.
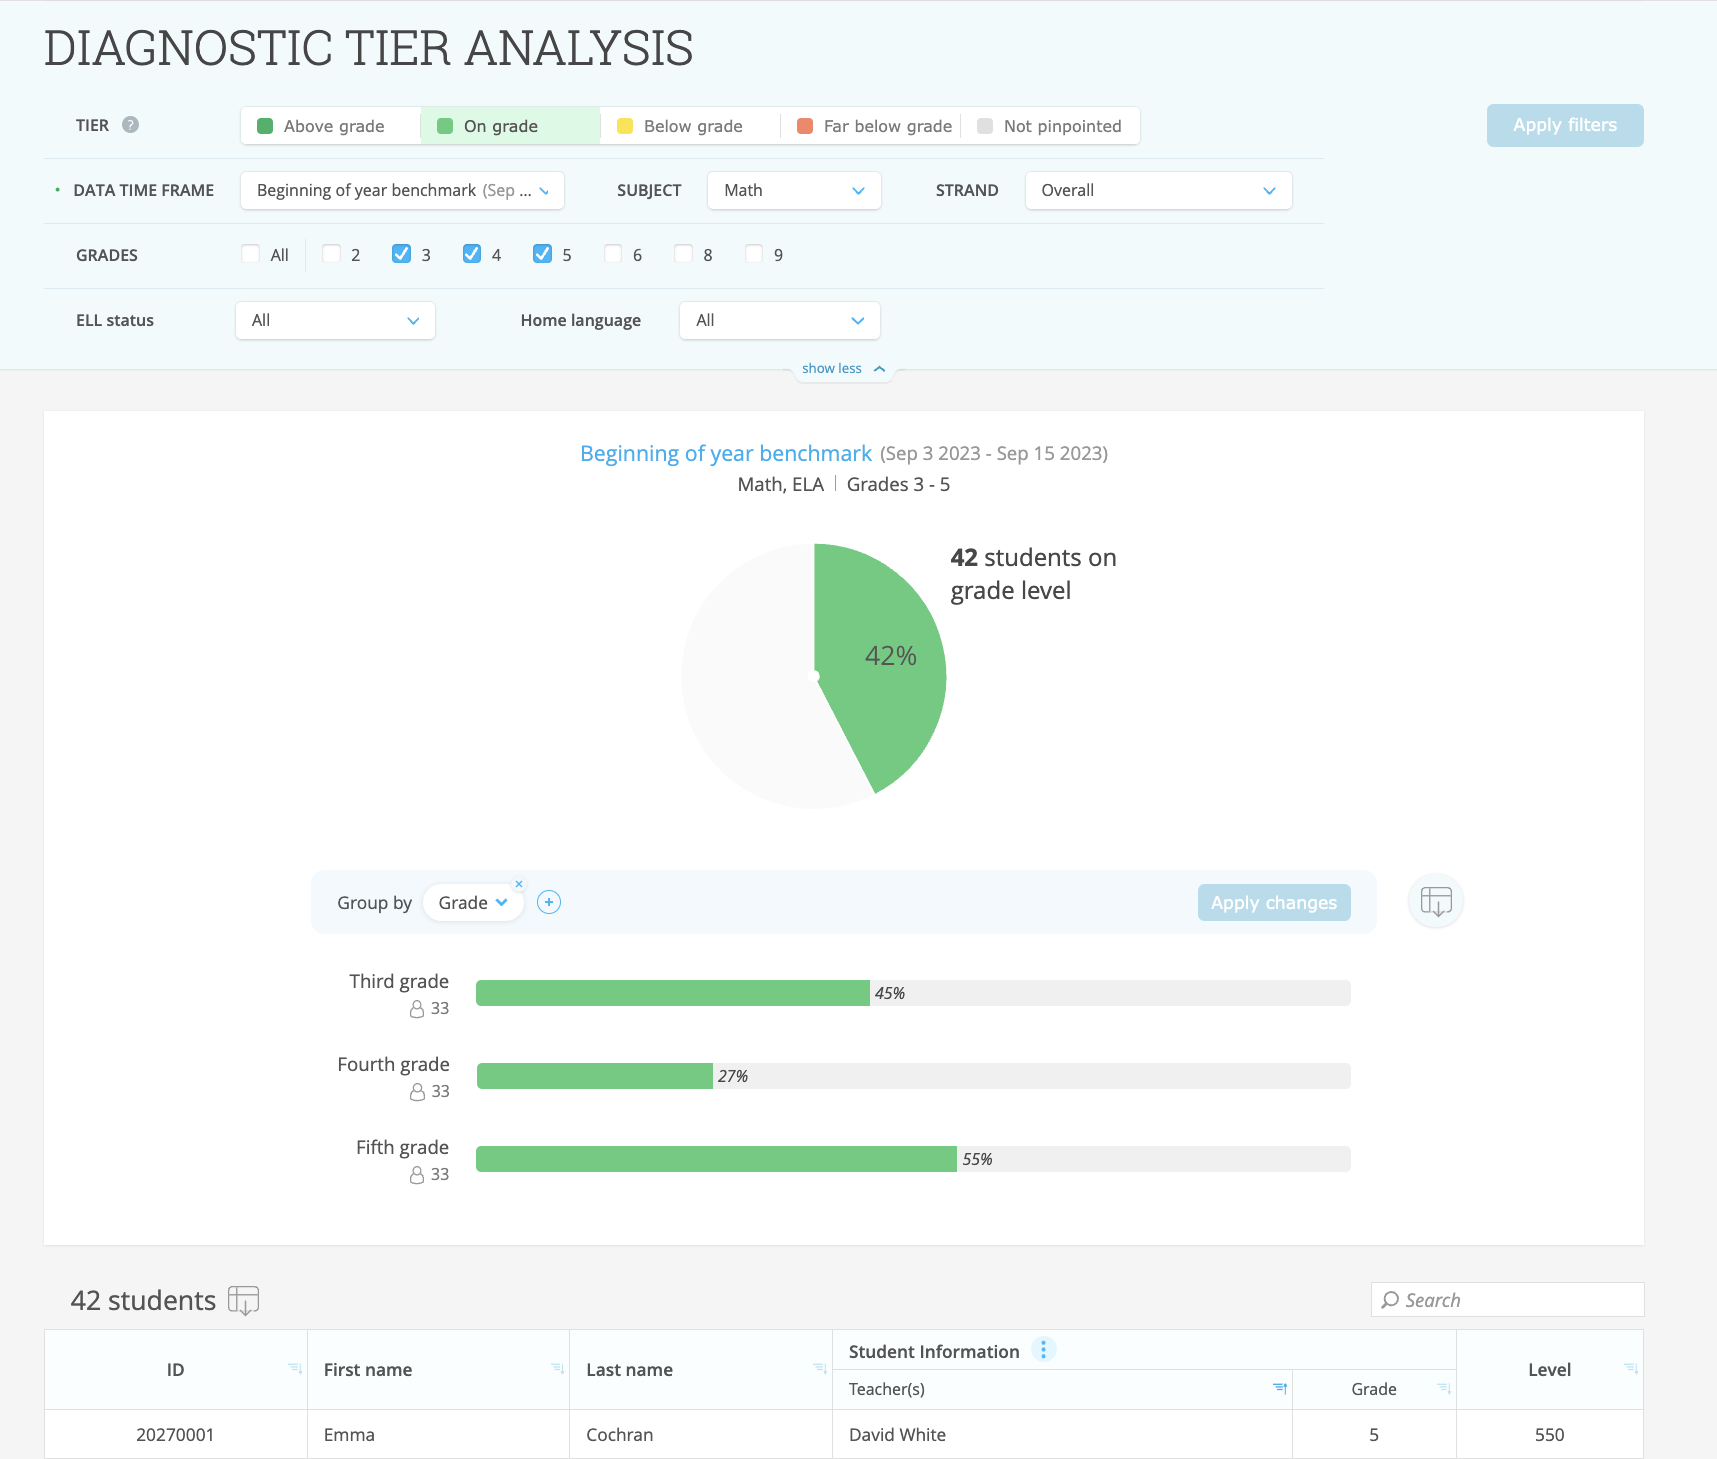
Diagnostic Tier Analysis report
See exactly which students fall into different performance categories such as “above grade level” and “below grade level,” as well as their diagnostic levels.
With this data you can supply detailed information to other administrators and teachers, boosting progress where it’s needed most.
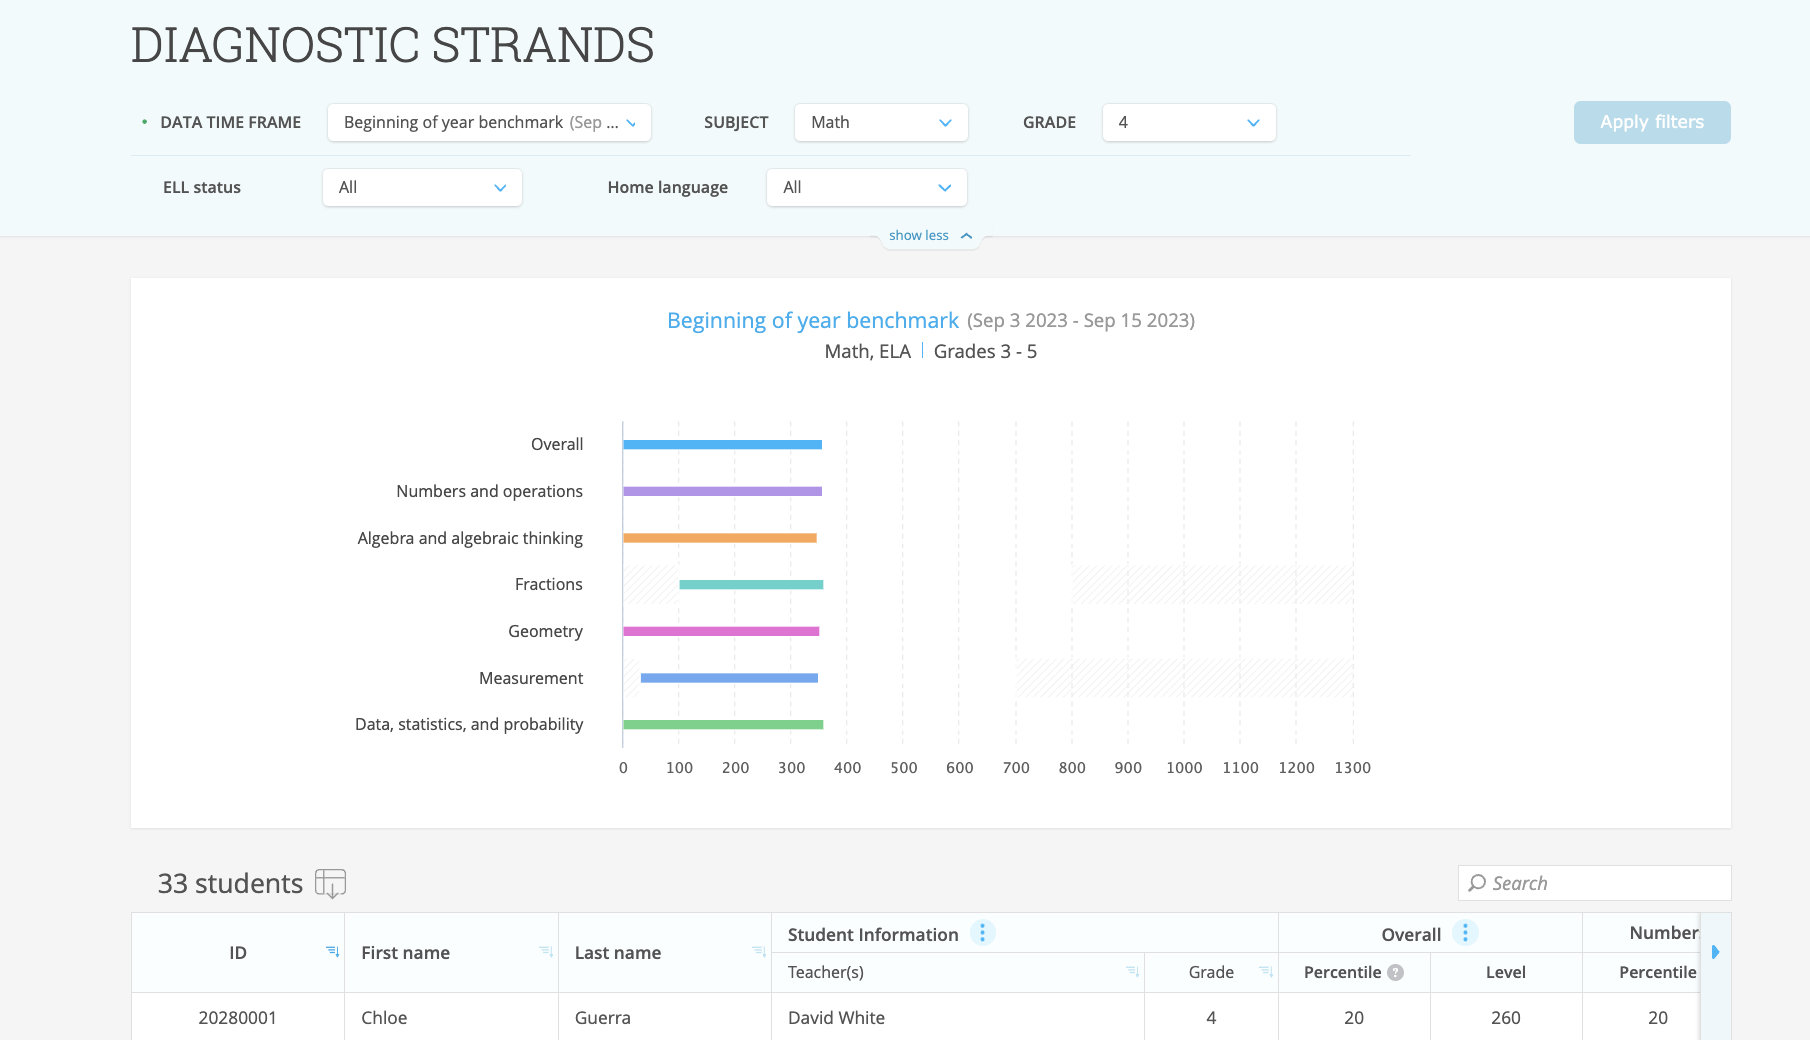
Diagnostic Strands report
This report displays average student performance in a single grade level broken down into math and ELA strands.
Use the Diagnostic Strands report’s data to focus classroom teachers’ instruction on areas that need the most improvement.
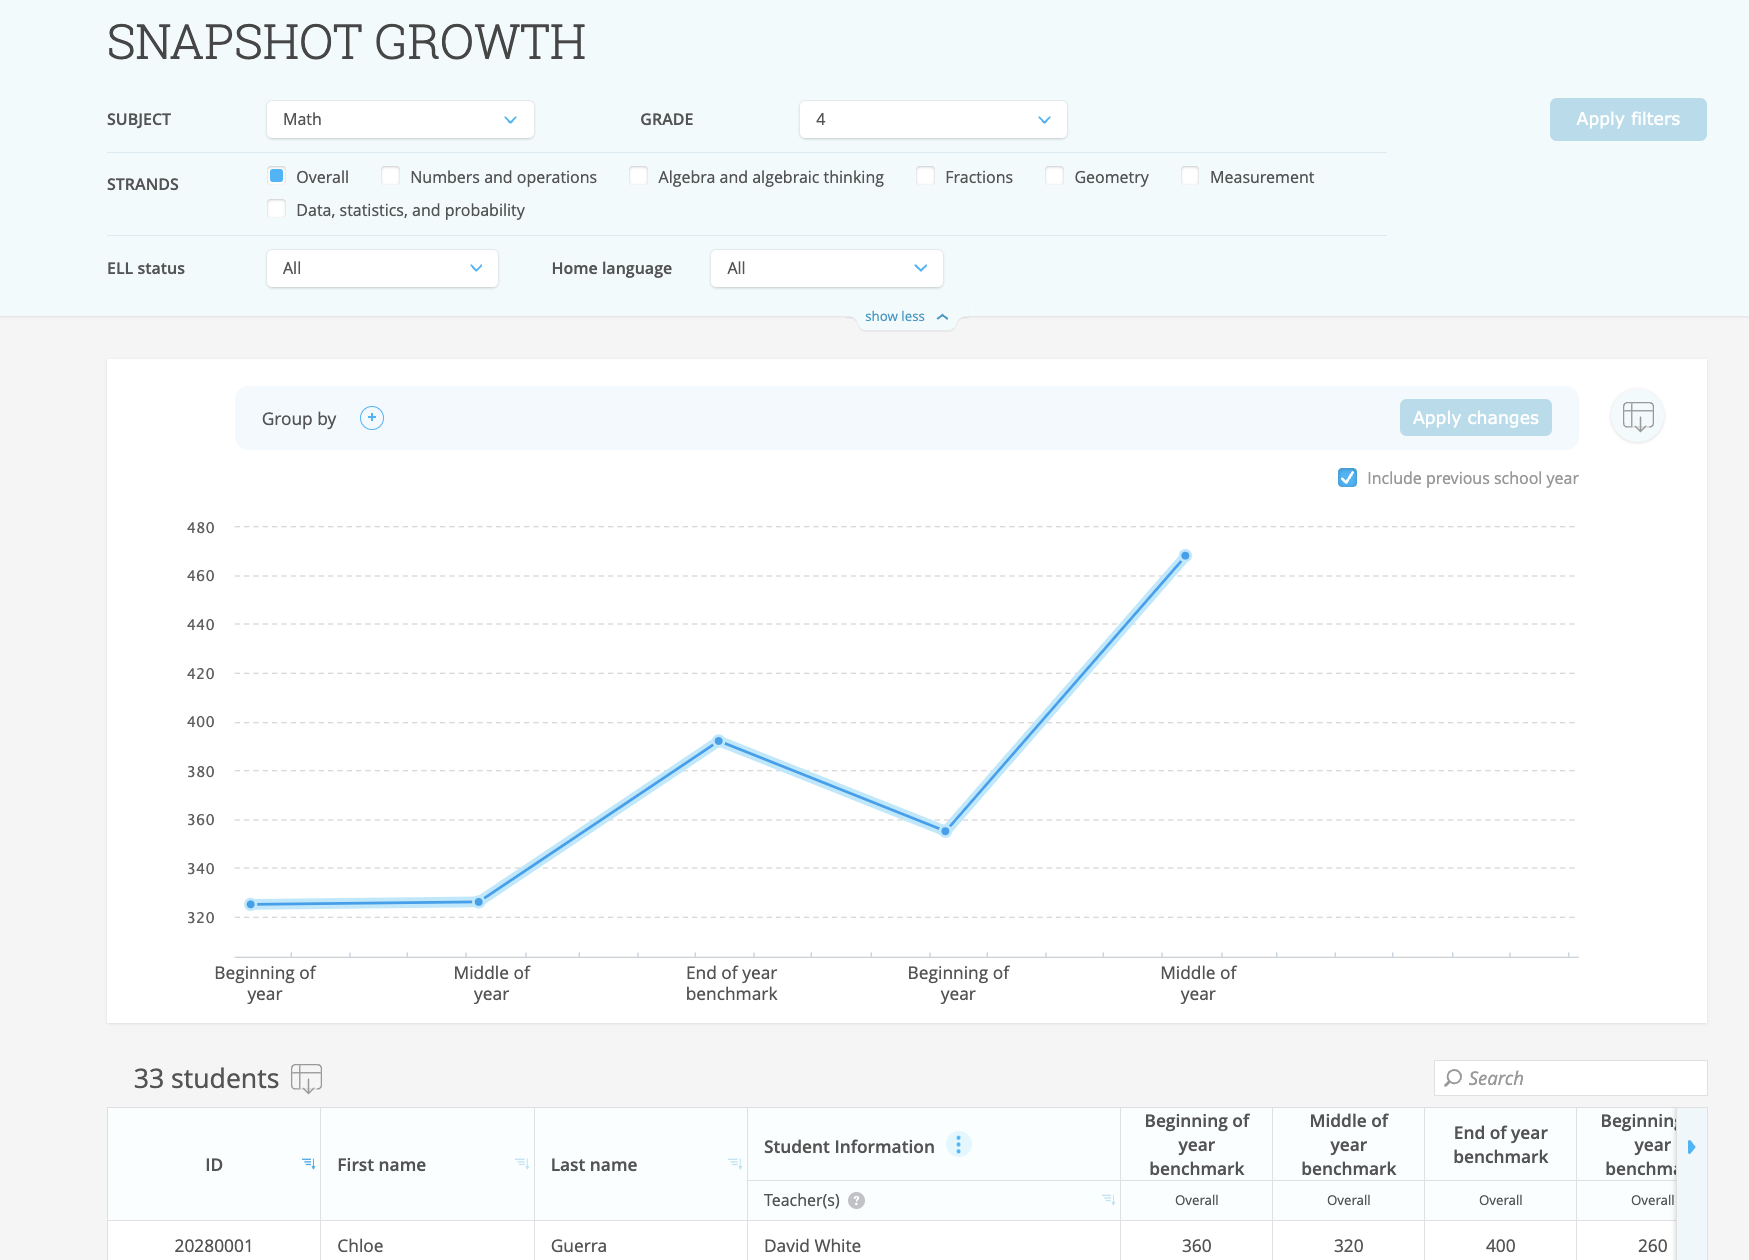
Snapshot Growth report
If your school is using IXL’s Diagnostic Snapshot to gather benchmark data, the Snapshot Growth report visualizes progress for every completed Snapshot in this and the previous school year.
By helping you track changes, this report is great for identifying strategies that successfully raised performance, celebrating schoolwide wins, and implementing strategies for student cohorts that need an extra push.
Want to see what else IXL can do for your school? Browse our admin resource center to see how IXL supports ELL students, blended learning, RTI/MTSS, and more!